Satellite pictures of the surf: what a Sentinel-2 pass tells you about a break
A forecast says what the swell will do. It does not say where on the beach it will break. A satellite picture taken while the waves were breaking shows exactly that, and a series of them shows which sandbanks keep working. Surf Spoting has collected 1,254 cloud-free pictures of 61 surf spots since 18 August 2026, and measures each one.
What a satellite picture shows about a surf break
From 786 km up, the European Sentinel-2 satellites photograph every coast every 2 to 5 days at about 11:30 local solar time, with pixels of 10 m. Breaking waves make foam, and foam is bright in visible light and dark in short-wave infrared, which is how it is told apart from sand, cloud and glare. So a pass shows, for that moment: how far out the waves were breaking along each stretch of the beach, where the peaks were (the places where the foam reaches clearly further out than next to it, which is where a bank or reef lifts the swell), and sometimes the swell lines themselves on the open water.
How a pass is processed
- A 2.2 km square around the spot is cut from the pass (Copernicus Sentinel-2 Level-2A, via the Earth Search catalogue).
- Cloudy passes are discarded. Sentinel-2's own cloud mask labels bright foam as cloud, so the mask is corrected wherever the infrared says foam.
- Whitewater is detected pixel by pixel, with thresholds adapted to each scene.
- The beach is sliced every 50 m along the shore and, for each slice, the distance the foam reaches from the shoreline is measured. Slices that reach clearly further than both neighbours are peaks, labelled left, right or A-frame from the shape of the foam.
- Over the last weeks, the peaks that come back pass after pass are kept as the spot's working banks, with how often each was seen.
- Where the open water is clear, a two-dimensional Fourier transform of the picture gives the spacing and direction of the swell lines, and from the spacing the period.
- Each pass is stored with the model conditions at that hour (swell, period, direction, wind, tide), so a picture can be compared with what the forecast said.
An example: Guincho, 2 November 2026
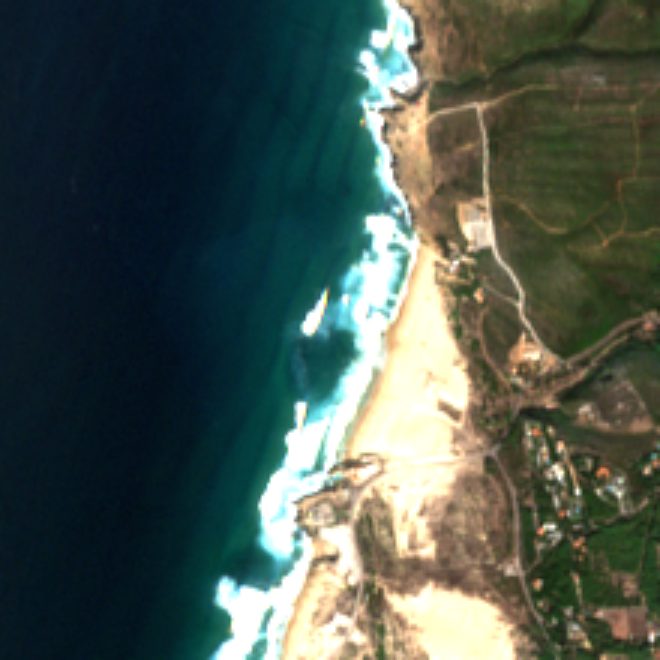
At the time of the pass the models gave a swell of 1.6 m at 10 s from NW, a wind of 3 km/h and a tide of -0.3 m, falling. On the picture the foam reaches 175 m from the shoreline on average, and the analysis finds 2 peaks: a right with foam out to 216 m and a left with foam out to 293 m.
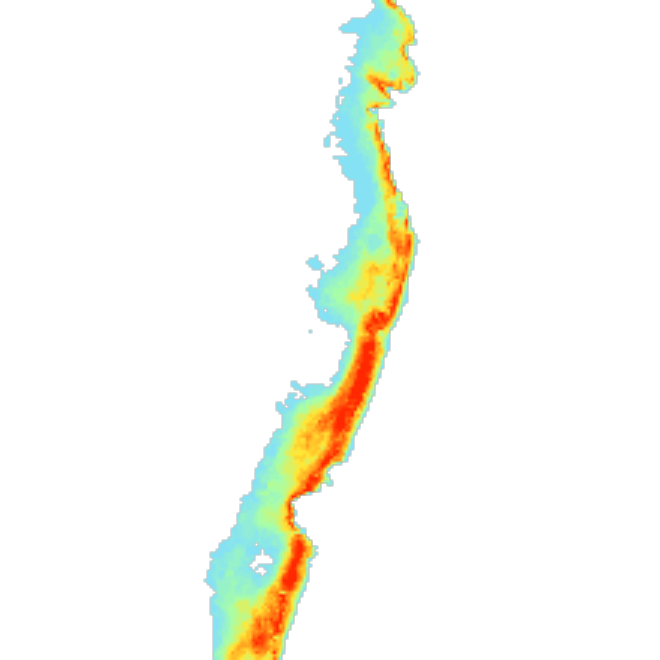
Across 27 cloud-free passes since 31 August 2026, 3 banks come back often enough to count: a right seen in 6 of 17 passes, a right seen in 8 of 17 passes, an A-frame seen in 8 of 17 passes. That is the kind of fact a forecast cannot give you: which part of the beach has been breaking, whatever the swell does tomorrow.
What it is good for
- Where to paddle out. On a long beach, the map of recurring foam says which stretch has had the banks.
- Whether a bank survived a storm. Compare the passes before and after.
- Checking the forecast. A pass with the model conditions attached is a free observation: if the model said 2 m and the foam reaches 50 m, something is off. We use this to see which wave model fits each beach best.
Limits
- A pixel is 10 m, so small surf makes little foam and can be missed; the method works best from about waist high.
- One picture is one moment at one tide. Clouds hide about a quarter of the passes.
- Rocks, islets, harbour walls and boat wakes can look like foam. Reef and point breaks give a cleaner signal than crowded beaches with groynes.
- The bank history is evidence of where waves have broken, not a live report and not a guarantee for tomorrow. It is one input next to the models, the buoys and the webcams, and the method has not yet been validated against measured bathymetry.
Where to see it
Open a spot in the app and add it to your favourites: the Satellite section shows the latest pictures, the foam map and the passes of the last weeks. Spots that already have pictures say so on their page here, for example Guincho, Supertubos and Nazaré.
Data: Copernicus Sentinel-2 (European Space Agency, European Commission), free and open under the Copernicus data licence; "contains modified Copernicus Sentinel data". Processing: Surf Spoting's own, described in full there. Questions or a bank you know we got wrong: hello@surfspoting.com.